

Market penetration rate is the share of a defined target market that has purchased or used your product, expressed as a percentage. The formula is straightforward: (number of customers ÷ total target market) × 100. Wall Street Prep documents this formula and stresses that estimating your total addressable market (TAM) before you calculate is the step most teams skip.
The penetration rate meaning, in one sentence: it tells you how much of your available market you have actually converted into customers, not just reached or exposed to your brand.
A dollar-based variant also exists: (total sales dollars ÷ total target market sales potential) × 100. Both formulas answer the same question from different angles, and Investopedia explains when each is appropriate. One quick note on terminology: "penetration rate" appears in several fields, including mobile phone adoption and oil-drilling. When writing for marketing or product contexts, use "market penetration rate" to avoid ambiguity.
Key Takeaways
Market penetration rate is calculated as (customers ÷ total target market) × 100, and its accuracy depends entirely on how precisely you define the TAM and the customer counting rule before you run the numbers.
| Point | Details |
|---|---|
| Core formula | (Customers ÷ TAM) × 100; a dollar-based variant uses total sales ÷ market sales potential × 100. |
| Define TAM first | Set eligibility criteria for your target market before calculating; population-level denominators distort results. |
| Fix your time window | Choose a consistent period (e.g., trailing 12 months) and hold it constant across all reporting cycles. |
| Align counting rules | Count unique buyers or active users, document the rule, and never mix definitions across periods. |
| Pair with other metrics | Combine penetration rate with churn, ARPU, and conversion rates for a complete strategic picture. |
Table of Contents
- What does penetration rate actually measure?
- How to calculate penetration rate step by step
- How to interpret your penetration rate results
- Common mistakes that distort your penetration rate
- Practical strategies to increase your penetration rate
- Industry examples and benchmark ranges
- An editorial perspective on using this metric well
- Sources
What does penetration rate actually measure?
Market penetration rate measures the proportion of a defined population that has taken a purchase or usage action, not just seen an ad or visited a page. Wikipedia defines it as the percentage of the relevant population that has purchased a brand or category at least once within the period under study.
Common use cases include tracking a product launch, monitoring feature adoption inside a platform, validating whether a paid campaign drove actual conversions, and assessing how much runway remains in a given market.
The metric is frequently confused with two others:
| Metric | What it measures | Unit |
|---|---|---|
| Market penetration rate | Share of target market that has purchased/used | % of people or revenue |
| Market share | Your revenue as a share of total category revenue | % of dollars |
| Reach / awareness | Share of population exposed to a message | % of impressions |
SurveyMonkey notes the practical difference clearly: penetration counts behavioral conversion into customers, while market share counts revenue, and reach counts exposure.
How to calculate penetration rate step by step
Follow these four steps every time, and your results will be consistent and comparable across periods.
- Define your target population (TAM). Decide who could realistically buy your product. A B2B SaaS tool for mid-market finance teams in the U.S. has a very different TAM than "all businesses."
- Set a time window. Choose a fixed period, such as the trailing 12 months, and hold it constant across all calculations.
- Choose a customer counting rule. Decide whether you are counting unique purchasers, active subscribers, or lifetime buyers. Mixing these rules across periods invalidates comparisons.
- Apply the formula. Divide your customer count by the TAM and multiply by 100.
Pro Tip: For subscription products, count only users active within your chosen time window, not all-time sign-ups. Lifetime counts inflate the rate and mask churn.
Reporting both figures together is worth the extra step. High user penetration paired with low revenue penetration often signals a pricing or monetization gap, not a distribution problem.
How to interpret your penetration rate results
A high rate approaching the upper bound of your TAM suggests the market is maturing. Similarweb explains that penetration nearing saturation implies limited room for linear acquisition-driven growth, and that a strategic shift toward retention or product innovation becomes necessary.
Context shapes everything here. Track the rate over time rather than reading a single snapshot. Cohort comparisons, such as comparing penetration among customers acquired in Q1 versus Q3, reveal whether your acquisition quality is improving.
When penetration plateaus despite increased spend, that is usually the signal to shift focus: improve onboarding, reduce churn, or expand the product to serve adjacent segments rather than pushing harder on the same acquisition channels.
Common mistakes that distort your penetration rate
Getting the formula right is easy. Getting the inputs right is where most teams go wrong.
- Wrong denominator. Using total population instead of your actual TAM inflates the denominator and makes penetration look artificially low. Define TAM by realistic eligibility criteria, not census size.
- Inconsistent time windows. Comparing a 12-month count one quarter to a 6-month count the next produces a meaningless trend line.
- Double-counting customers. A customer who bought twice in the period is still one customer. Count unique buyers unless your metric is explicitly "transactions."
- Confusing reach with penetration. Ad dashboards sometimes label campaign reach as "penetration." Investopedia is explicit: penetration requires conversion into users or customers, not just exposure.
- Undocumented assumptions. If you change your TAM source or counting rule mid-year, every prior period becomes incomparable. Write your assumptions into a measurement spec and version-control it.
Pro Tip: Before sharing a penetration figure with stakeholders, attach a one-line footnote: "TAM source: [X], customer definition: unique purchasers, time window: trailing 12 months." That single habit prevents most misinterpretations.
Practical strategies to increase your penetration rate
Moving the number requires deliberate choices across acquisition, retention, and product.
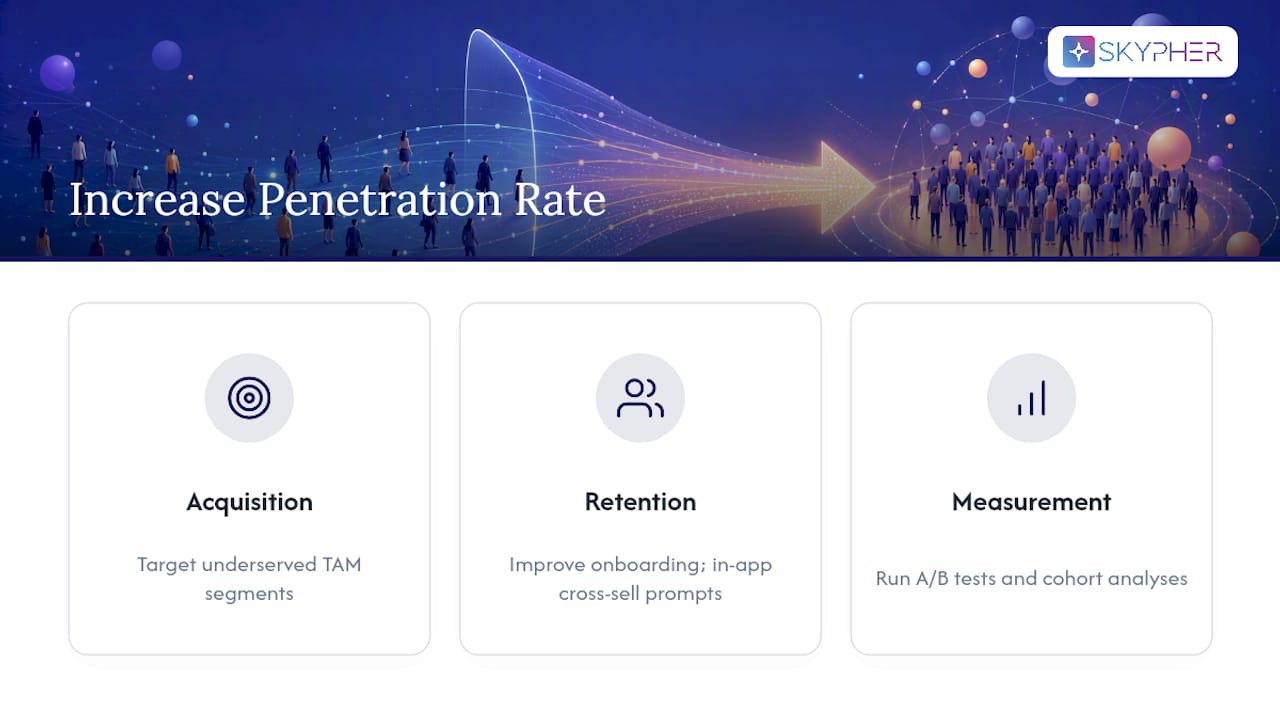
Acquisition levers include targeted campaigns aimed at underserved segments within your TAM, channel expansion into distribution points your current customers don't use, and pricing experiments that lower the barrier to a first purchase. Knowing how to identify your target audience precisely is what separates a campaign that grows penetration from one that just recycles existing customers.
Retention and usage levers matter more than most teams expect. Improving onboarding reduces early churn, which means each new customer actually stays in your "active" count. Product-led growth tactics, such as in-app prompts that drive cross-sell or usage milestones, increase the depth of adoption within your existing base.
Measurement discipline ties it together. Run A/B tests or cohort-based analyses to isolate which lever actually moved the rate. Without a controlled comparison, you cannot tell whether a penetration gain came from a pricing change, a new channel, or seasonal demand. SaaS analytics approaches that tie campaign exposure to purchase events give you the clearest signal.
Industry examples and benchmark ranges
Penetration rates vary enormously by category, and any benchmark you find should be treated as directional, not prescriptive. The rate depends entirely on how TAM and customer rules are defined.
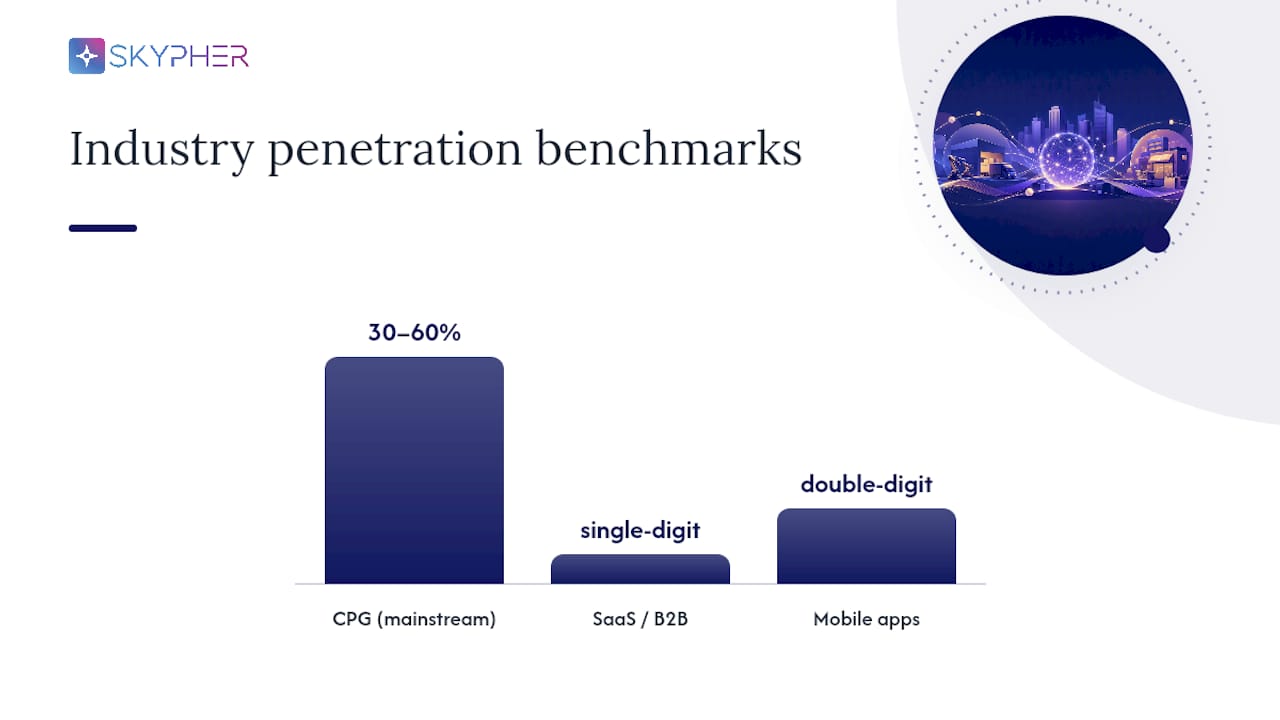
- Consumer packaged goods (CPG): Household penetration for a mainstream category brand can reach 30–60% of households in a given year, but niche brands often sit well below 5%.
- SaaS and B2B software: Enterprise tools targeting a narrow vertical commonly see single-digit penetration rates, even among well-known platforms. For context on how SaaS security products measure adoption, the eligible TAM is often a few thousand companies, not millions.
- Mobile apps: Consumer apps in large categories can achieve double-digit penetration of smartphone users, but retention, not initial install, determines whether that figure holds.
- Insurance: The NFIP residential penetration rate dataset from FEMA is one of the most disciplined public examples of penetration measurement: it computes insured residential structures as a ratio of total residential structures, with a clearly documented denominator and no ambiguity in counting rules.
The FEMA example is worth studying regardless of your industry. The discipline of a fixed denominator definition and a transparent counting rule is exactly what makes a penetration metric trustworthy over time.
An editorial perspective on using this metric well
One thing we see consistently: teams spend more energy debating whether their penetration rate is "good" than they spend agreeing on what the denominator actually is. The metric is only as credible as the assumptions underneath it.
Penetration rate works best as one lens among several. Pair it with churn rate to understand whether new customers are staying, with ARPU (average revenue per user) to catch monetization gaps, and with conversion rates at each funnel stage to identify where acquisition is breaking down. No single percentage tells the whole story, and presenting penetration in isolation to a leadership team often produces the wrong strategic conversation.
Sources
- Market Penetration Rate | Formula + Calculator - Wall Street Prep
- Market penetration - Wikipedia
- Market penetration - Investopedia
- Market penetration: Calculation & A 6 Step Guide - Similarweb
- Market Penetration: What It Is, Strategies & How To Measure - SurveyMonkey