

TL;DR:
- Real-time GRC compliance monitoring continuously validates controls against regulations, reducing manual audit efforts. Establishing explicit control mappings, automated data connectors, and prioritizing high-risk frameworks enhances compliance and developer adoption. This approach transforms security teams into risk managers while streamlining audit readiness through integrated, automated workflows.
Real-time GRC compliance monitoring is the practice of continuously monitoring controls against regulatory requirements rather than relying on point-in-time audits. Instead of scrambling to collect evidence weeks before an audit, your systems automatically validate that controls are operating correctly, generate audit-ready evidence, and alert the right people when something drifts out of compliance. For medium to large tech and finance organizations, this shift is less a luxury and more a structural necessity.
A mature real-time GRC compliance monitoring setup typically includes:
- A Compliance Reference Library that catalogs authority documents, control objectives, and control templates for each applicable framework
- Technical control mappings linking IaC configurations, access logs, and system configurations to specific requirements in SOC 2, ISO 27001, NIST CSF, and PCI DSS
- A centralized GRC platform acting as the system of record for all audit evidence
- Automated data connectors pulling from cloud environments, CI/CD pipelines, and ticketing systems
- Notification and escalation workflows that fire when controls fail, rather than when auditors ask
The practical payoff is real: continuous control monitoring replaces manual, periodic sampling with automated surveillance, cutting audit preparation time and cost significantly. Security teams stop being evidence collectors and start being risk managers.
Table of Contents
- How to map technical controls to regulatory frameworks in real-time GRC
- How to configure automated connectors and workflows for continuous compliance
- How to balance compliance automation with developer experience and adoption
- Step-by-step: building your real-time GRC monitoring setup
- Key Takeaways
How to map technical controls to regulatory frameworks in real-time GRC
Mapping controls to frameworks is where most real-time GRC setups either succeed or quietly fall apart. The goal is a clean, deterministic relationship between what your systems do and what your regulators require.
Start by building your Compliance Reference Library. Platforms like GRC for Jira recommend configuring Authority Documents, Compliance Requirements, Control Objectives, and Control Templates as the foundational layer before any automation runs. This library is the schema everything else references.
Once the library exists, the mapping work begins:
- Link each IaC configuration check (for example, an unencrypted S3 bucket rule) to the specific SOC 2 Common Criteria or ISO 27001 Annex A control it satisfies
- Map access log monitoring to NIST CSF Detect functions and PCI DSS logging requirements simultaneously, since most controls satisfy multiple frameworks at once
- Use your GRC platform as the audit evidence repository so every control evaluation writes its result to a single system of record
One discipline that separates high-performing teams from struggling ones: applying compliance-as-code principles to keep alerts deterministic. Generic security warnings create noise. Alerts tied directly to a named regulatory control tell the control owner exactly what failed and why it matters. Tools like AegisGRC use Open Policy Agent rules mapped explicitly to SOC 2 Common Criteria, so every violation message names the criterion it violates rather than issuing a vague security warning.
Organize your controls by framework and control objective, not by system or team. That structure makes it far easier to produce framework-specific compliance reports and to identify gaps when a new regulatory requirement arrives.
How to configure automated connectors and workflows for continuous compliance
With your control mappings defined, the next step is wiring up the data sources that feed them. This is the most technically intensive part of the setup, and also the part most teams underestimate.
Connector configuration typically covers:
- Cloud environments (AWS, Azure, GCP) via API or native integrations
- CI/CD tools such as GitHub Actions or Jenkins, where policy-as-code checks run at commit or pull request time
- Ticketing systems like Jira, where control deficiencies automatically generate tracked issues
- Identity and access management systems for user provisioning and access log collection
Automated compliance platforms can generate audit-ready PDF and JSON evidence packages and push alerts directly into collaboration tools, which removes the manual step of compiling evidence before each audit cycle. Platforms like Pulumi Insights & Governance take this further by blocking non-compliant deployments across CIS, NIST, HITRUST, and PCI DSS without disrupting developer workflows.
Common failure modes to plan for:
- Data type mismatches when pulling from non-native sources (a date field formatted as a string will break rule evaluation)
- Connection failures from expired credentials or locked service accounts, which silently stop evidence collection
- Alert fatigue when notification thresholds are set too broadly, causing control owners to ignore messages
For escalation workflows, differentiate by audience. Control owners need direct links to specific violations. GRC administrators need infrastructure failure alerts immediately. Auditors generally benefit from digest reports rather than real-time pings.
Pro Tip: Start your connector rollout with the two or three frameworks that carry the highest audit risk for your organization, whether that is SOC 2 for your SaaS customers or PCI DSS for your payment infrastructure. Automating high-risk controls first delivers measurable compliance improvements quickly and builds organizational confidence before you expand to lower-priority frameworks.
How to balance compliance automation with developer experience and adoption
The most technically correct GRC setup will fail if developers route around it. Shadow IT and compliance bypass are not hypothetical risks; they are predictable outcomes when compliance friction is high enough.
The framing that works is treating compliance automation as a developer experience challenge, not a security gate. When a developer gets a clear, specific policy failure message during a pull request review, with an AI-generated fix suggestion attached, they can resolve it in minutes. When they get a vague security warning from a separate tool they have to log into separately, they defer it indefinitely.
Practical integration points include:
- PR comments that surface specific control failures with remediation guidance inline
- CI/CD pipeline checks that run policy-as-code evaluations before deployment, with non-blocking advisory mode during initial rollout
- Slack or Microsoft Teams notifications routed to the team that owns the affected system, not a generic security channel
The iterative rollout approach matters here. Start in advisory mode, where violations are visible but not blocking. Give teams two or three sprint cycles to remediate existing issues before switching enforcement to mandatory. This approach, sometimes called progressive enforcement, prevents the compliance program from becoming a deployment bottleneck on day one.
Pro Tip: Measure developer adoption as a first-class KPI alongside compliance pass rates. If your policy checks are running but developers are bypassing them through manual overrides or workarounds, your compliance posture is weaker than your dashboard suggests. Track override rates by team and treat a rising override rate as an early warning signal.
Key KPIs to track once the program is running:
- Control pass rate by framework, tracked weekly
- Mean time to remediation for control failures
- Evidence coverage rate: percentage of controls with automated evidence versus manual collection
- Override and bypass rate across CI/CD enforcement points
For teams managing key compliance frameworks like SOC 2 and ISO 27001 simultaneously, these metrics make it possible to demonstrate continuous compliance to auditors rather than reconstructing a point-in-time snapshot.
Step-by-step: building your real-time GRC monitoring setup
Here is how we recommend approaching the full implementation, from planning through operationalization.
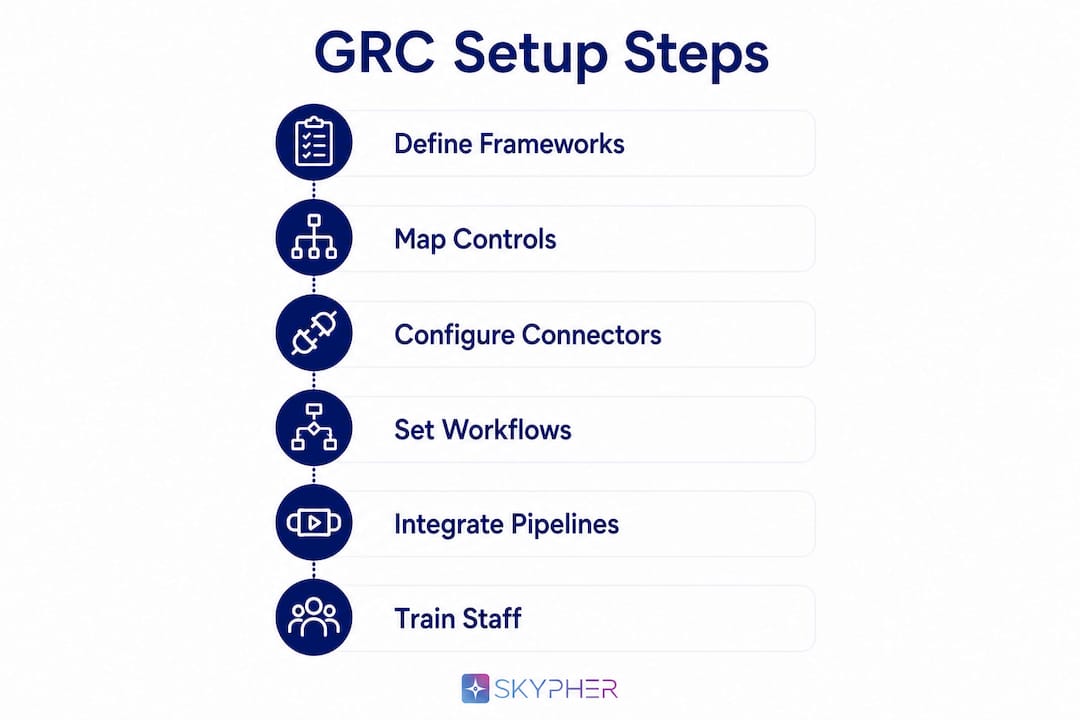
Step 1: Define your compliance frameworks and build the Compliance Reference Library. Identify which frameworks apply to your organization. SOC 2 is nearly universal for US tech companies selling to enterprise customers; PCI DSS applies if you handle payment data; ISO 27001 and NIST CSF are common in finance. For a deeper comparison of ISO 27001 vs. SOC 2, the control overlap is substantial, which means a well-structured library reduces duplication significantly. Load authority documents, control objectives, and control templates into your GRC platform before touching any connectors.
Step 2: Map technical controls to framework requirements. For each control in your library, identify the specific technical evidence that proves it is operating. An access review control maps to IAM logs and user provisioning records. An encryption control maps to IaC configuration checks and key management audit logs. Document these mappings explicitly in the GRC platform so they survive staff turnover.

Step 3: Configure automated connectors. Connect your GRC platform to the systems that produce evidence: cloud providers, identity management, CI/CD pipelines, and ticketing. Validate each connector by confirming that sample records return correctly before activating rule evaluation. Test for data type consistency, especially when pulling from non-SAP or non-native sources.
Step 4: Set up notification and escalation workflows. Define who receives what, at what threshold. Control owners get violation alerts with direct links to the affected control. Security leadership gets weekly compliance posture summaries. GRC administrators get infrastructure failure alerts immediately. Use dynamic variables in notification templates so messages include the rule name, violation count, and a summary rather than a generic alert.
Step 5: Integrate into developer pipelines with progressive enforcement. Deploy policy-as-code checks into CI/CD workflows in advisory mode first. Surface results in PR comments and developer dashboards. After a defined remediation window, switch high-risk controls to blocking enforcement. Platforms like Pulumi support this progressive enforcement model natively.
Step 6: Train staff and plan for iterative scaling. Run a focused onboarding session for control owners covering how to read violation alerts, how to register deficiencies, and how to request evidence for audits. Plan quarterly reviews to add new controls, update framework mappings when regulations change, and retire controls that no longer apply. Scalability here is mostly organizational: the technical infrastructure scales more easily than the human processes around it.
For teams whose compliance program feeds directly into security questionnaire responses, connecting your GRC evidence library to your questionnaire workflow closes the loop entirely. Skypher's smart security knowledge base integrates with your compliance documentation so that when a customer sends a security questionnaire, your team can pull verified, current evidence rather than manually reconstructing answers from scattered sources.

Key Takeaways
A real-time GRC compliance monitoring setup works when technical controls are mapped explicitly to regulatory frameworks, automated connectors replace manual evidence collection, and compliance checks are embedded directly into developer workflows.
| Point | Details |
|---|---|
| Build the library first | Configure your Compliance Reference Library before connecting any data sources or writing any rules. |
| Map controls to frameworks explicitly | Each technical control needs a named regulatory requirement it satisfies, documented in the GRC platform. |
| Start with high-risk frameworks | Automate SOC 2 or PCI DSS controls first to deliver measurable compliance value before expanding scope. |
| Treat developer experience as a requirement | Advisory mode before enforcement, inline PR feedback, and team-routed alerts drive adoption without friction. |
| Track override rates alongside pass rates | Rising bypass rates signal that compliance checks are creating friction rather than preventing real risk. |