

A risk matrix is a visual grid that plots likelihood against impact so a team can see, at a glance, which risks demand immediate action and which ones just need monitoring. Its job is prioritization, not prediction. We recommend pairing it with documented controls, named owners, and a defined review cadence, because a matrix without governance is just a colorful chart.
TL;DR:
- A risk matrix should be scored twice, once for inherent risk and once after controls are applied, to accurately measure control effectiveness.
- A 5x5 matrix is the standard for larger organizations due to its 25 score combinations, providing finer risk differentiation than smaller formats.
- Risk descriptors must be concrete and specific; vague labels like "likely" or "major" can lead to inconsistent scoring between assessors.
- Regular updates, at least annually or after key events, are essential to keep the matrix accurate and audit-ready, with documented version history.
- Using thresholds that align scores with specific actions ensures rapid escalation for high or critical risks, and passive monitoring for low or medium ones.
Table of Contents
- What Is a Risk Matrix and Why Do Teams Use It?
- How a Risk Matrix Works: Axes, Scales, and Scoring
- Common Matrix Formats: 3x3, 4x4, and 5x5
- How to Build a Risk Matrix in 5 Steps
- Turning Matrix Scores Into Action: Thresholds and Escalation
- Where Risk Matrices Fall Short
- Keeping a Risk Matrix Current: Cadence and Governance
- A Worked Example: Template and Sample Scoring
- What I've Learned Rolling Out Risk Matrices
- An Automation Layer for Documenting and Tracking Risk
- Standards and Guides Worth Bookmarking
- Sources
- FAQ
What Is a Risk Matrix and Why Do Teams Use It?
A risk matrix, sometimes called a probability-impact matrix or a risk assessment matrix, is a two-axis grid that ranks each identified risk by how likely it is to occur and how severe the consequences would be if it did. That's the whole mechanism. What makes it valuable is what it lets a team do next: compare dozens of unrelated risks (a vendor going bankrupt, a server outage, a compliance gap) on the same visual scale so leadership can decide where to spend limited time and budget.
We've watched teams try to manage risk through spreadsheets with no shared scoring logic, and the result is always the same: everyone argues about priorities because nobody agreed on what "high risk" means. A matrix fixes that by forcing a shared vocabulary before the scoring starts.
The practical benefits show up in three places:
- Prioritization — risks cluster visually, so the highest-scoring items are obvious without reading a 40-row spreadsheet line by line.
- Communication — a color-coded grid explains risk posture to executives in seconds, which a narrative report rarely does.
- Audit evidence — a documented matrix with dated scores and named reviewers becomes proof that risk assessment actually happened, which matters when an auditor asks.
That last point is why the matrix shows up in formal frameworks. NIST's Cybersecurity Framework treats risk assessment as a central activity that feeds directly into control selection. ISO's risk management standard requires a documented assessment process, and matrix outputs satisfy that requirement when the scales and thresholds are clearly defined. PMI treats the same logic as core project risk practice. If your organization is pursuing SOC 2, a matrix with defined criteria is often the first artifact an assessor requests.
How a Risk Matrix Works: Axes, Scales, and Scoring
Every risk matrix runs on two axes. Likelihood measures how probable the risk is to occur, usually on a scale from "rare" to "almost certain." Impact measures the severity of consequences if it does, ranging from "negligible" to "catastrophic." Each axis needs concrete descriptors, not vague labels: "likely" should mean something specific, like "expected to occur one or more times per year," not just a gut feeling.
Scoring is simple arithmetic: multiply the likelihood rating by the impact rating. On a 5x5 grid, that produces a number from 1 to 25, which then maps to a color-coded tier:
- Low (1 to 4) — green, monitor during standard review cycles.
- Medium (5 to 9) — yellow, assign an owner and track quarterly.
- High (10 to 15) — orange, requires an active mitigation plan and monthly checkpoints.
- Critical (16 to 25) — red, escalate immediately to leadership with a remediation timeline.
A 5x5 matrix with these five likelihood and five impact levels gives you 25 possible score combinations, which is why it's the format most GRC platforms default to.
Pro Tip: Score every risk twice. First, score it "inherent," meaning the raw risk with no controls applied. Then score it "residual," meaning the risk level after your existing controls are factored in. The gap between those two numbers is the actual value your controls are delivering, and it's the number leadership actually wants to see.
Recording both scores matters for more than internal clarity. Auditors reviewing evidence for ISO or SOC 2 want to see the inherent score, the specific controls applied, an assessment of how effective each control is, and the resulting residual score, all timestamped with a reviewer's name attached.
Common Matrix Formats: 3x3, 4x4, and 5x5
Matrix size isn't a stylistic choice. It's a decision about how much resolution your data and your stakeholders can actually support.
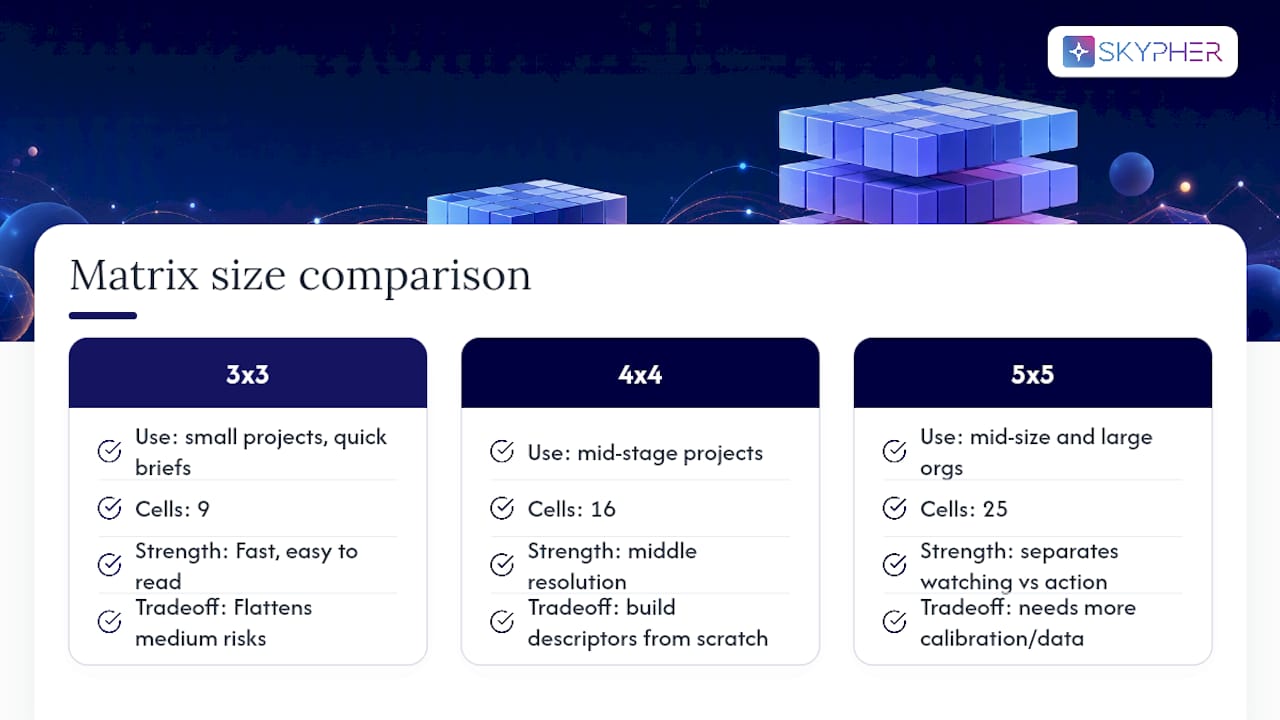
A 3x3 matrix works best for small projects, quick executive briefings, or teams just starting a risk program. Three likelihood levels (low, medium, high) crossed with three impact levels give you nine cells, which is fast to build and easy for a non-technical stakeholder to read in a single glance. The tradeoff is obvious: nine buckets can't distinguish between a risk that's mildly concerning and one that's genuinely close to critical. Everything gets flattened into "medium."
The 5x5 matrix is the default most mid-size and large organizations land on, and it's the format most GRC platforms and frameworks are built around. Twenty-five cells give enough resolution to separate "worth watching" from "needs a mitigation plan this quarter" without requiring the kind of granular data that a 7x7 or custom grid demands.
Consider a 4x4 matrix when your organization sits between those two needs, often in mid-stage project environments where a 3x3 feels too coarse but the team lacks the historical data to justify five full tiers on each axis. It's less common in published standards, so you'll usually be building your own descriptors from scratch rather than adapting a template.
Larger or custom matrices (6x6, asymmetric grids, matrices with separate scales for financial versus reputational impact) show up mostly in mature enterprise risk programs with dedicated risk analysts. They demand more calibration work up front, and if your assessors aren't well trained on the descriptors, a bigger grid just produces more inconsistent scoring, not better insight. Project teams frequently start with a 3x3 for speed and graduate to 5x5 as the risk register matures.
How to Build a Risk Matrix in 5 Steps
Building a usable matrix is less about design and more about discipline. Here's the process we walk clients through when they're standing up a risk register for the first time.
1. Define scope, timeframe, and stakeholders. Decide what you're assessing (a single project, a product line, the whole organization) and over what period (quarterly, annual). Pick your risk categories up front: operational, financial, cybersecurity, compliance, reputational, and third-party are common buckets. Name who owns the exercise and who needs to sign off on final scores.
2. Set concrete likelihood and impact scales. This is the step most teams rush, and it's the one that determines whether your matrix produces consistent results. Vague labels like "unlikely" mean different things to different people. Instead, write descriptors like:
- Likelihood 2 ("unlikely"): expected to occur less than once every three years, based on historical incident data where available.
- Impact 4 ("major"): causes a service outage exceeding four hours, or triggers a mandatory regulatory disclosure.
3. Build the grid, thresholds, and action zones. Lay out your chosen size (3x3, 4x4, or 5x5), assign the color tiers, and write down exactly what action each tier requires. This is also where you decide escalation rules: who gets notified automatically when a risk lands in the red zone.
4. Score inherent risk, map controls, and calculate residual risk. For each identified risk, score it as if no controls existed. Then list every control currently mitigating that risk, rate how effective each one is, and recalculate the score with controls factored in. The difference between inherent and residual is your evidence that the control environment is working.
5. Assign owners, schedule reviews, and log it in a risk register. Every risk needs a named owner accountable for tracking it, not just a category. Set your review cadence (more on that below) and put the whole thing in a structured risk register: spreadsheet at minimum, GRC platform once the volume grows. Without a register, your matrix is a snapshot that goes stale the day you finish it.
Turning Matrix Scores Into Action: Thresholds and Escalation
A score means nothing until it triggers a decision. That's the step most teams skip, and it's the one an auditor will ask about first.
Map every tier to a specific required action, not a vague sentiment:
- Low scores: monitor passively, revisit at the next scheduled review.
- Medium scores: assign an owner, document a mitigation plan, revisit quarterly.
- High scores: active mitigation with a deadline, monthly status checkpoints, visibility to a risk committee.
- Critical scores: immediate escalation to leadership, remediation timeline required within days, not weeks.
Every risk owner needs to be a real person, not a department. And every owner assignment should link back to the specific control evidence they're responsible for maintaining, because that link is what an auditor traces when they're checking whether your residual score is credible or just optimistic.
Pro Tip: Build your reporting cadence around the risk tier, not a fixed calendar. Critical and high risks get reported monthly regardless of when your "official" quarterly review lands. Low and medium risks can safely wait for the scheduled cycle. Reporting everything on the same calendar either buries urgent items or drowns leadership in noise.
Documentation discipline matters here as much as the scoring itself. Every review should leave a paper trail: date, reviewer name, prior score, new score, and the reason for any change. That trail is what turns a matrix from an internal planning tool into audit-ready evidence.
Where Risk Matrices Fall Short
Risk matrices are communication tools first, mathematical instruments a distant second, and treating them as the latter causes real problems.
The most cited flaw is range compression. Multiplying two ordinal scales (say, a 3 for likelihood and a 4 for impact) produces a number that looks precise but isn't. Two very different risks can land on the identical score of 12 even though one is a slow-building compliance gap and the other is an active security exposure. Academic critiques of the risk matrix point out that this compression means matrices often can't reliably rank many risk pairs against each other at all, especially for rare, high-impact events where the likelihood scale breaks down entirely.
Risk matrices frequently fail to distinguish between hazard pairs that should sit far apart on any meaningful risk ranking, because the ordinal math treats a 3x4 the same as a 2x6 or a 4x3, even when the real-world risks behind those numbers are nothing alike.
Subjectivity is the second major weakness. Two assessors scoring the same risk can land on wildly different numbers if the descriptors are vague. The fix isn't complicated, but it takes discipline: write concrete, example-based descriptors for every level on every axis, and run periodic calibration sessions where multiple assessors score the same sample risks and compare notes.
A few practical guardrails help contain both problems:
- Use weighted scoring for categories where certain impact types (regulatory, safety) should never be treated as equal to lower-stakes categories.
- Layer in quantitative techniques, like Monte Carlo simulation, for your highest-stakes, lowest-frequency risks rather than trusting a single ordinal score.
- Revisit your descriptor definitions annually. Descriptors that made sense two years ago often don't reflect current incident data.
Keeping a Risk Matrix Current: Cadence and Governance
A matrix built once and never revisited is worse than no matrix at all, because it gives false confidence. Governance is what keeps it honest.
Set a baseline review cadence, typically annual, and supplement it with event-driven updates. A security incident, a new product launch, a regulatory change, or a significant vendor shift should all trigger an immediate reassessment of any risk they touch, regardless of where you are in the annual cycle.
Every update needs a paper trail:
- Version history showing what changed and when.
- Reviewer notes explaining why a score moved.
- Direct links between each control and the evidence proving it's actually operating (a test result, a log export, a signed attestation).
That level of detail supports ISO and NIST-aligned audit trails, and it's exactly what an IT risk framework implementation needs to hold up under review.
Spreadsheets work fine for a first matrix covering a few dozen risks. The moment your organization is tracking risks across multiple business units, linking them to hundreds of controls, or needing real-time dashboards for a board committee, GRC platforms with automated evidence linking start paying for themselves in reduced manual update time.
A Worked Example: Template and Sample Scoring
A usable risk register needs a consistent set of fields for every entry, regardless of the matrix size behind it. At minimum, track: risk description, category, likelihood score, impact score, inherent risk tier, controls in place, control effectiveness rating, residual risk tier, owner, and next review date.
Here's how that plays out for a realistic scenario: a critical vendor's data center experiencing extended downtime.
The inherent score of 12 lands in the high tier and would trigger monthly monitoring on its own. Once the failover architecture and contractual SLA are factored in, the likelihood drops and the residual score falls to medium, still worth tracking, but no longer an active escalation. That movement from 12 to 8 is the evidence a security or compliance lead brings to a leadership review to justify continued investment in the failover setup.
For teams building out a full register, real-world examples across industries can help you adapt category definitions and descriptors to your own risk types rather than starting from a blank template.
What I've Learned Rolling Out Risk Matrices
Start simple. A clean 5x5 grid with well-written descriptors beats an elaborate custom matrix that nobody trusts because the scoring feels arbitrary. Complexity should follow better data, never precede it. Add a weighted category, a sixth tier, or a quantitative overlay only after you've proven the basic version works and your team has enough historical incident data to justify the extra granularity.
The single most persuasive number in any leadership conversation is the gap between inherent and residual scores. It's the concrete proof that your controls are earning their budget, and it reframes risk management from a compliance chore into a value story.
Before rolling anything out broadly, run a short checklist: calibrated descriptors tested against real historical examples, named owners for every risk category, and mandatory evidence fields built into the register from day one. Skipping that last step is the single most common mistake we see, and it's the one that turns an audit into a scramble. For more on avoiding early missteps, these practical tips for tech leaders are worth a read before you finalize your first version.
— Gaspard
An Automation Layer for Documenting and Tracking Risk
The scoring judgment in a risk matrix has to stay human. But the paperwork behind it, gathering evidence, chasing control owners for updates, formatting responses for the fifth security questionnaire this quarter, doesn't need to eat a compliance team's week every time. That's where Skypher fits: it doesn't replace your risk-scoring process, it clears the administrative weight sitting on top of it.

The Questionnaire Automation Tool pulls from your existing knowledge base to answer security questionnaires in any format, with confidence scoring so your team knows exactly which answers need a human review before they go out. Real-time collaboration means your risk owners and compliance leads work from the same version instead of emailing spreadsheets back and forth. A customizable Trust Center lets you publish your compliance posture once, so prospects and auditors can self-serve instead of generating another one-off request. For teams drowning specifically in due diligence questionnaires, Fiduciary-Grade DDQ Automation handles that volume directly.
If evidence gathering is the bottleneck slowing down your risk register updates, exploring dedicated software solutions may show how much of that work can be automated or streamlined.
Standards and Guides Worth Bookmarking
For readers building or auditing a risk matrix, these are the primary sources worth going straight to rather than relying on secondhand summaries:
- NIST Cybersecurity Framework — the definitive government-backed reference for how risk assessment feeds control selection.
- ISO's risk management standard — the formal documentation requirements auditors check against.
- PMI's risk analysis guidance — practical project-level risk scoring and common pitfalls.
- Risk matrix — Wikipedia — a solid primer on the concept and its academic critiques.
- Flow GRC's risk assessment matrix guide — detailed, practitioner-oriented walkthroughs of 5x5 templates and thresholds.
Sources
- Risk matrix — Wikipedia
- NIST Cybersecurity Framework
- Risk Assessment Matrix: The Complete Guide for 2026 | Flow GRC Blog
- Risk analysis project management | PMI
- ISO standard on risk management
FAQ
What Is a Risk Matrix in Risk Management?
A risk matrix is a visual grid used in risk management to score and rank risks by plotting how likely each one is against how severe its consequences would be. It's the tool most frameworks, including NIST's, point to when they ask organizations to document their risk assessment process.
What Is a 5x5 Risk Matrix?
A 5x5 risk matrix rates likelihood and impact on five-point scales each, producing 25 possible score combinations that map to tiers like low, medium, high, and critical. It's the format most mid-size and large organizations default to because it offers enough resolution to separate genuinely urgent risks from ones that just need monitoring.
What Is a 3x3 Risk Matrix?
A 3x3 risk matrix uses three levels each for likelihood and impact, producing a smaller set of score combinations. It works well for small projects or quick executive summaries where speed matters more than granular differentiation between risk levels.
What Are the Five Risk Categories?
Common risk categories include operational, financial, cybersecurity, compliance, and reputational, though the exact list varies by organization and industry. Most teams define their own categories during the scoping step of building a matrix, based on what actually threatens their specific operations.
How Often Should a Risk Matrix Be Updated?
Most organizations review their risk matrix on an annual baseline, supplemented by event-driven updates triggered by incidents, product launches, or regulatory changes. Every update should be logged with a version history and reviewer notes to support audit trails aligned with ISO and NIST guidance.